Synthetic Person Data Generator
Synthetic person records with 65 jointly-distributed attributes — demographics, health, behavioral, financial — calibrated against public US reference data.
Demographic-first generator. Returns synthetic person records with 65 jointly-distributed attributes across 9 domains (identity, geography, social, financial, behavioral, health basics, health conditions, healthcare utilization, medications). Each marginal distribution cites a public source (ACS 2022, NHANES 2017-2020, CDC NDSS, KFF 2023, MEPS 2022, BLS 2023, USPS L005 2024). Cross-field invariants are enforced: BMI = weight/(height/100)², ZIP matches state per USPS SCF ranges, insulin only fires for diabetics. Deterministic by seed. Three locales (en-US full fidelity; en-GB / en-IN identity-native with en-US health fallback, disclosed via locale_data_source). Async bulk generation: submit a job, download the JSONL or CSV file via a download URL.
Parameters
| Name | Type | Req | Default | Description |
|---|---|---|---|---|
count |
integer |
optional | 100000 |
Number of person records to generate. Range: 1–5,000,000. |
seed |
integer |
optional | (derived from job_id) |
RNG seed for reproducibility. Same seed + same params = byte-identical records. |
locale |
string |
optional | en-US |
Locale: en-US, en-GB, en-IN. Health attributes use en-US fallback for en-GB / en-IN. |
idFormat |
string |
optional | ulid |
ID format: ulid, uuidv7, uuid, nanoid, cuid2. |
Example record
{
  "id": "64PG6RYQXXD7XFEKZJ6AW616M7",
  "given_name": "Elizabeth", "family_name": "Robinson",
  "age": 31, "sex_at_birth": "female",
  "race": "white", "ethnicity": "hispanic",
  "locale": "en-US", "country": "US", "state": "IL", "urbanicity": "suburban",
  "education": "some_college", "insurance_type": "marketplace",
  "height_cm": 171.8, "weight_kg": 76.4, "bmi": 25.9, "waist_circumference_cm": 89.1,
  "diabetes_status": "diagnosed_t2dm", "family_history_diabetes": true,
  "visits_past_year": 7, "number_of_prescriptions": 1, "on_insulin": false
  // ... 49 more attributes
}Call it
# 1. Register once — returns your clientId and sets a session cookie
curl -sS -c cookies.txt -X POST https://api.simpleidgen.com/v1/auth/register \
  -H 'Content-Type: application/json' \
  -d '{"name":"You","email":"you@company.com","password":"your-password"}'

# 2. Submit a generation job (uses the saved cookie)
curl -sS -b cookies.txt -X POST https://api.simpleidgen.com/v1/datasets/person \
  -H 'Content-Type: application/json' \
  -d '{"clientId":"<your client id>","count":100000,"seed":42}'

# 3. Poll status, then download the JSONL once completed
curl -sS -b cookies.txt https://api.simpleidgen.com/v1/datasets/<job_id>
// After registering or logging in (session cookie set), submit a job:
const res = await fetch('https://api.simpleidgen.com/v1/datasets/person', {
method: 'POST',
credentials: 'include',
headers: { 'Content-Type': 'application/json' },
body: JSON.stringify({ clientId: '<your client id>', count: 100000, seed: 42 }),
});
const { jobId, statusUrl } = await res.json();import requests
s = requests.Session()
s.post('https://api.simpleidgen.com/v1/auth/login', json={'email': 'you@company.com', 'password': '...'})
job = s.post('https://api.simpleidgen.com/v1/datasets/person', json={'clientId': '<your client id>', 'count': 100000, 'seed': 42}).json()
print(job['jobId'], job['statusUrl'])Generation requires a free account — it takes about 10 seconds and gives you a client ID and an API session.
Create a free accountAlready have one? Log in.
/v1/datasets/person
Async — submit a job, poll /v1/datasets/{job_id}, then download JSONL.
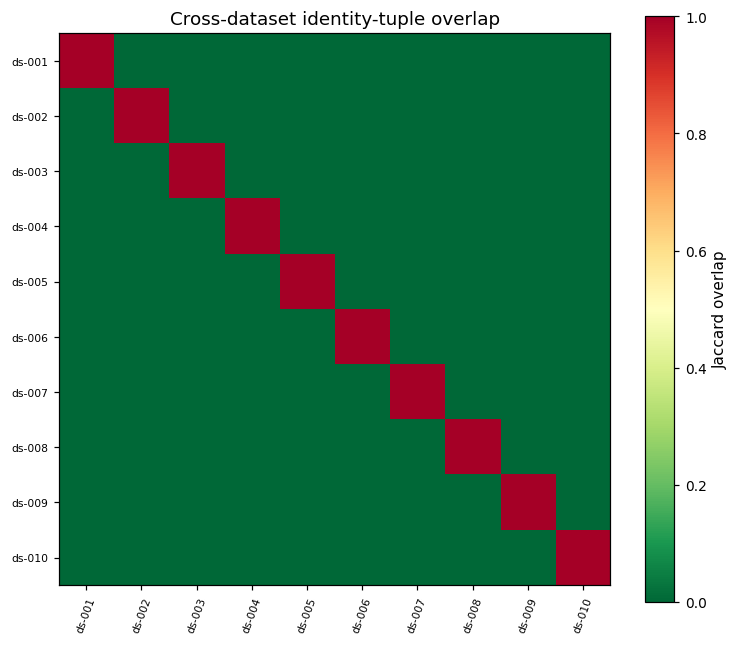
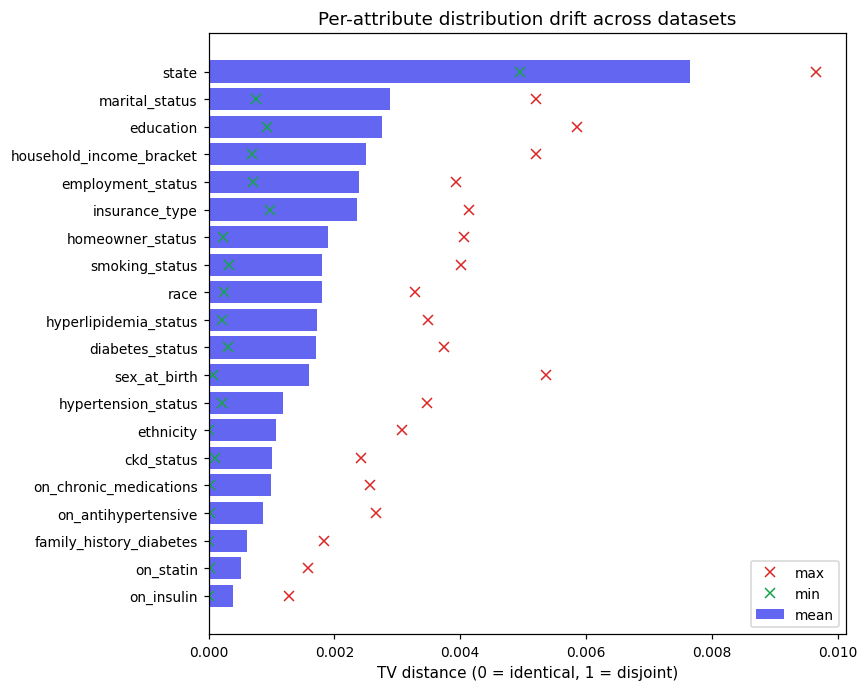
Multiple datasets — 10 × 200K records
Variance evidence: 10 independent regenerations of ~200K rows each (a different base seed per run), pooled and cross-checked across 45 pairwise comparisons.
Categorical fidelity
Chi-squared test vs reference; effect size is Cramér's V. A small effect size = the synthetic distribution tracks the reference.
| Attribute | Verdict | Cramér’s V |
|---|---|---|
ckd_status | match | 0.097 |
diabetes_status | match | 0.072 |
education | match | 0.069 |
employment_status | match | 0.054 |
ethnicity | match | 0.007 |
hypertension_status | match | 0.017 |
insurance_type | match | 0.081 |
marital_status | match | 0.043 |
race | match | 0.097 |
sex_at_birth | match | 0.001 |
smoking_status | match | 0.057 |
state | match | 0.004 |
Numeric fidelity
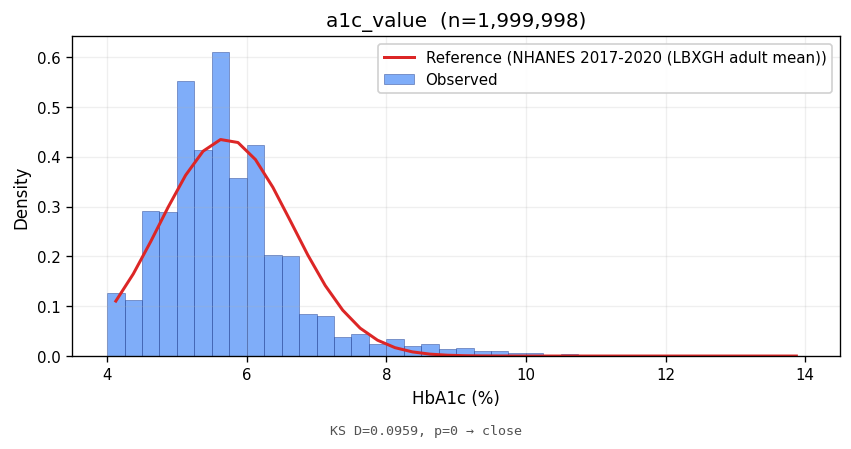
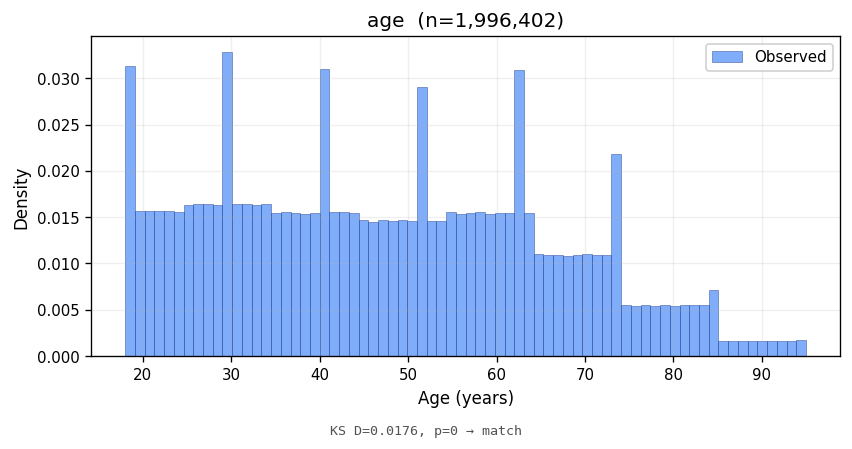
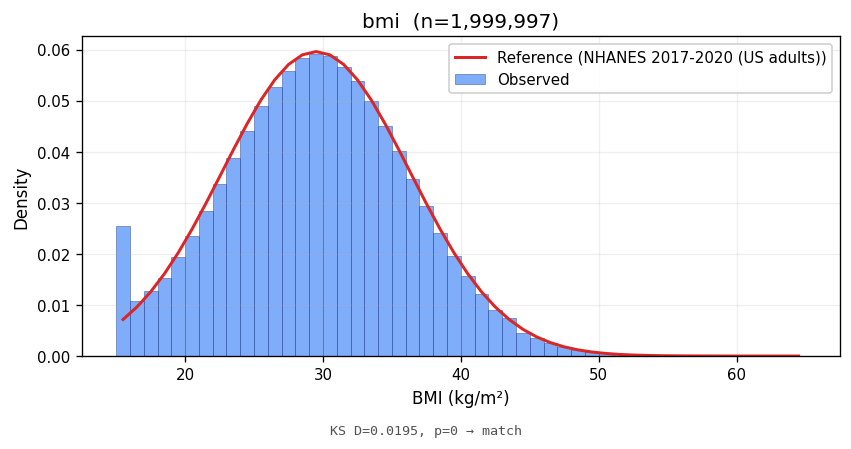
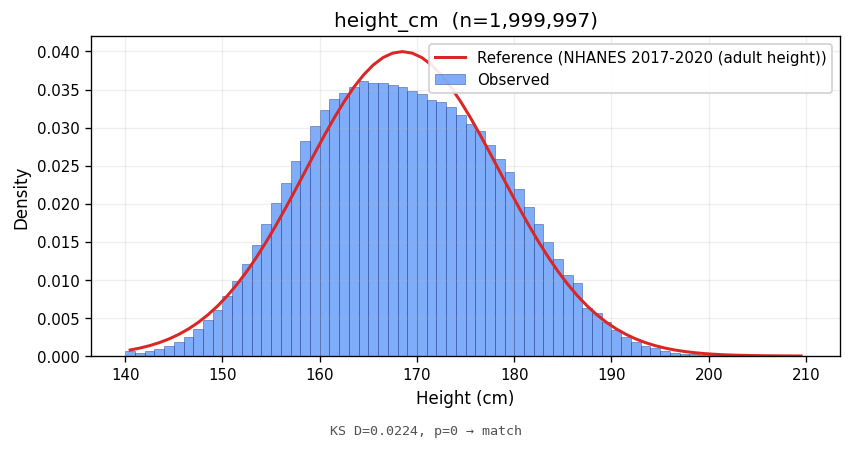
Kolmogorov–Smirnov distance vs the reference distribution; lower D = closer fit.
| Attribute | Verdict | KS D | Reference |
|---|---|---|---|
a1c_value | close | 0.0959 | NHANES 2017-2020 (LBXGH adult mean) |
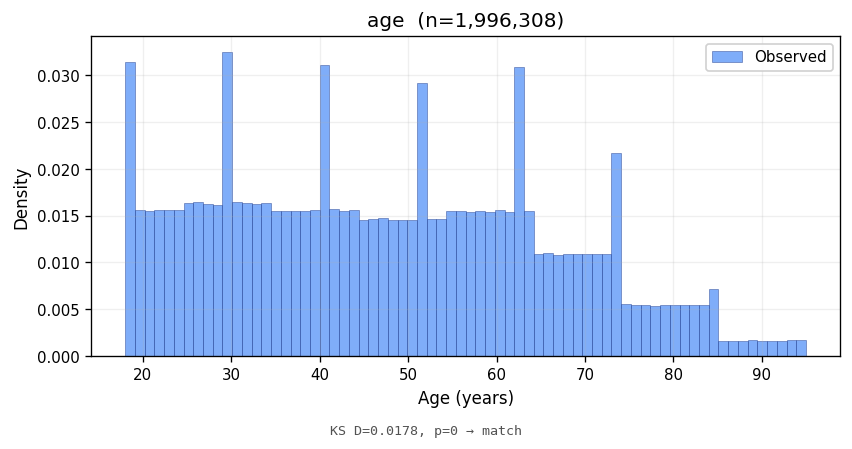
age | match | 0.0176 | ACS 2022 (US adults) |
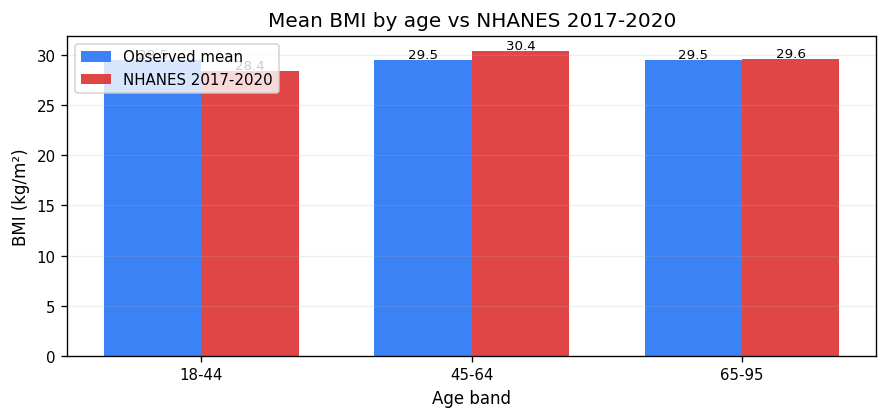
bmi | match | 0.0195 | NHANES 2017-2020 (US adults) |
height_cm | match | 0.0224 | NHANES 2017-2020 (adult height) |
waist_circumference_cm | match | 0.0106 | NHANES 2017-2020 (BMXWAIST adult mean) |
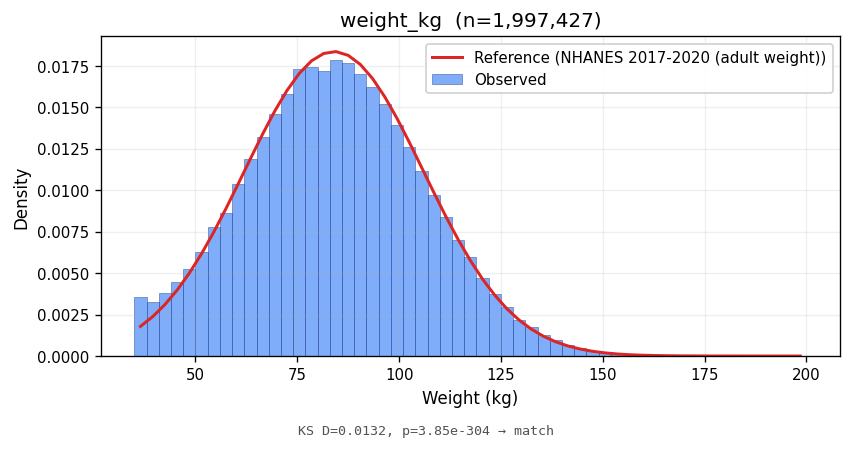
weight_kg | match | 0.0132 | NHANES 2017-2020 (adult weight) |
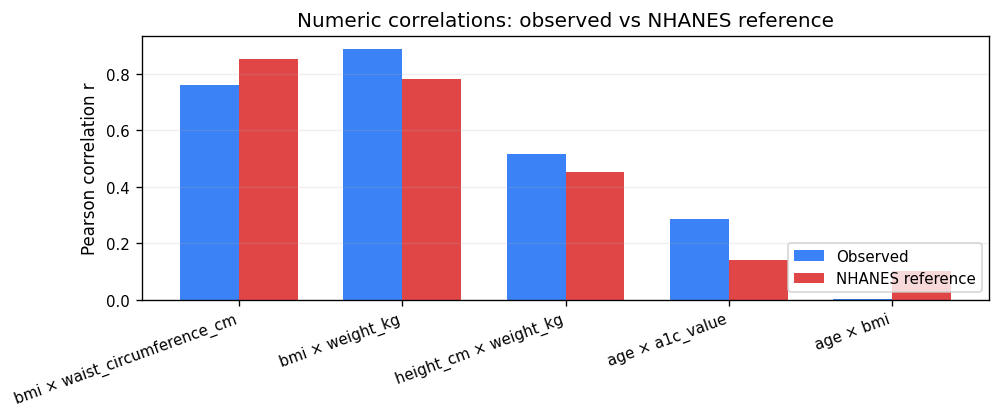
Correlations
Observed pairwise correlation vs the published reference.
| Pair | Observed | Reference | Verdict |
|---|---|---|---|
age × a1c_value | 0.285 | 0.140 | match |
age × bmi | 0.001 | 0.100 | match |
bmi × waist_circumference_cm | 0.760 | 0.850 | match |
bmi × weight_kg | 0.888 | 0.780 | match |
height_cm × weight_kg | 0.516 | 0.450 | match |
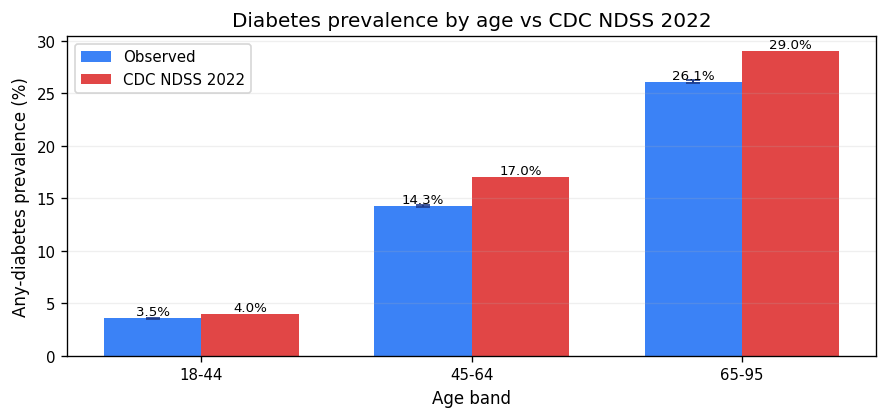
Distributions
Each attribute's generated distribution against its reference curve.
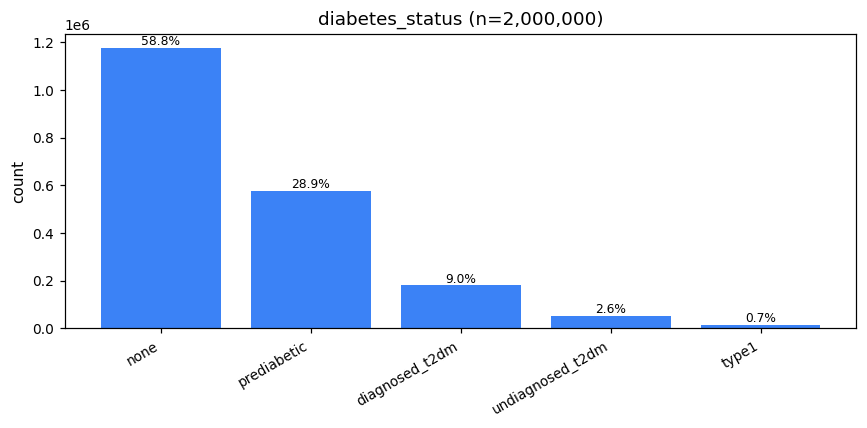
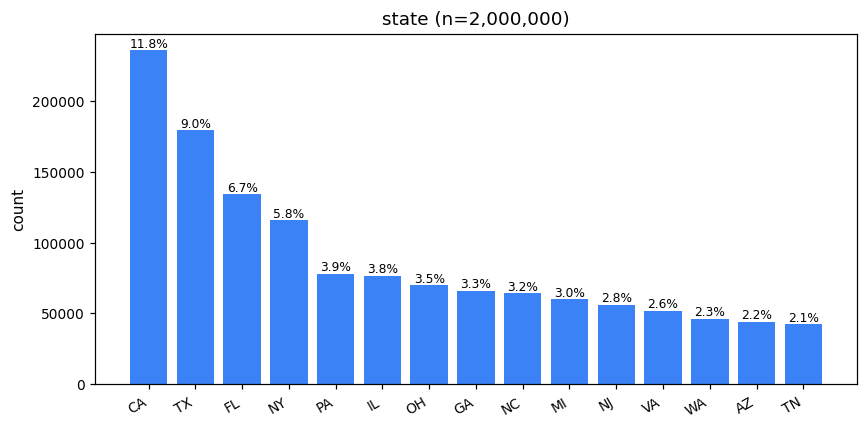
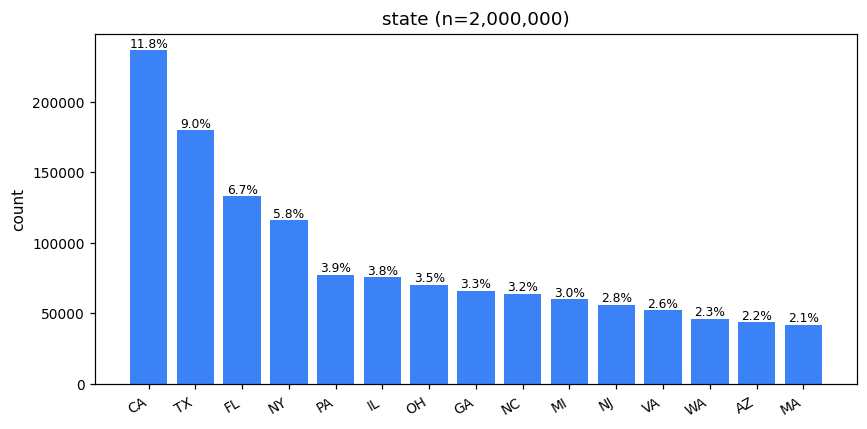
Generated category counts across 2,000,000 records.
| Category | Count | Share |
|---|---|---|
none | 1,175,791 | 58.8% |
prediabetic | 577,777 | 28.9% |
diagnosed_t2dm | 179,760 | 9.0% |
undiagnosed_t2dm | 52,350 | 2.6% |
type1 | 14,322 | 0.7% |

Generated category counts across 2,000,000 records.
| Category | Count | Share |
|---|---|---|
r50to100k | 576,766 | 28.8% |
r25to50k | 548,066 | 27.4% |
under25k | 440,838 | 22.0% |
r100to150k | 252,466 | 12.6% |
over150k | 181,864 | 9.1% |
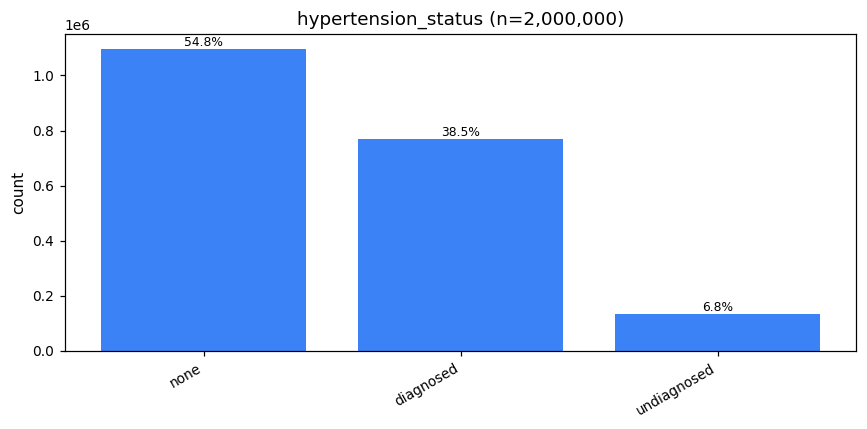
Generated category counts across 2,000,000 records.
| Category | Count | Share |
|---|---|---|
none | 1,095,100 | 54.8% |
diagnosed | 769,296 | 38.5% |
undiagnosed | 135,604 | 6.8% |

Generated category counts across 2,000,000 records.
| Category | Count | Share |
|---|---|---|
employer | 993,868 | 49.7% |
medicare | 363,217 | 18.2% |
medicaid | 263,121 | 13.2% |
uninsured | 186,952 | 9.3% |
marketplace | 84,181 | 4.2% |
other | 70,757 | 3.5% |
military | 37,904 | 1.9% |

Generated category counts across 2,000,000 records.
| Category | Count | Share |
|---|---|---|
white | 1,202,905 | 60.1% |
black | 252,023 | 12.6% |
multi_racial | 239,046 | 12.0% |
other | 167,835 | 8.4% |
asian | 120,230 | 6.0% |
aian | 13,877 | 0.7% |
nhpi | 4,084 | 0.2% |
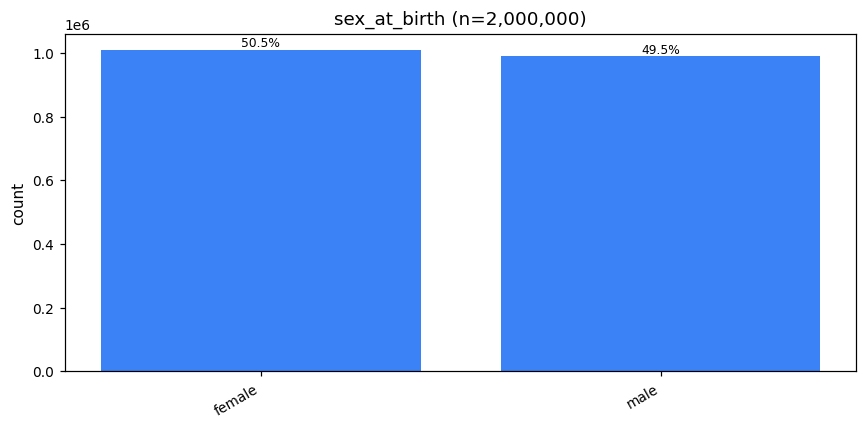
Generated category counts across 2,000,000 records.
| Category | Count | Share |
|---|---|---|
female | 1,010,597 | 50.5% |
male | 989,403 | 49.5% |
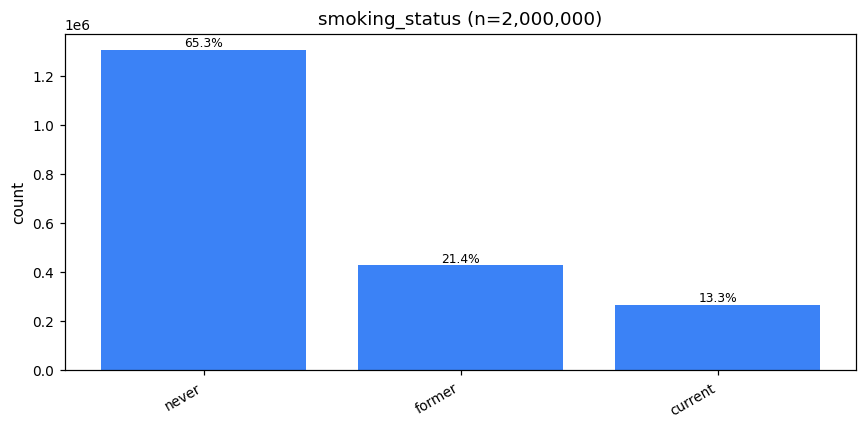
Generated category counts across 2,000,000 records.
| Category | Count | Share |
|---|---|---|
never | 1,305,530 | 65.3% |
former | 428,437 | 21.4% |
current | 266,033 | 13.3% |
Generated category counts across 2,000,000 records.
| Category | Count | Share |
|---|---|---|
CA | 235,867 | 11.8% |
TX | 179,501 | 9.0% |
FL | 134,192 | 6.7% |
NY | 115,876 | 5.8% |
PA | 78,106 | 3.9% |
IL | 76,501 | 3.8% |
OH | 69,882 | 3.5% |
GA | 65,993 | 3.3% |
NC | 64,088 | 3.2% |
MI | 60,052 | 3.0% |
NJ | 56,127 | 2.8% |
VA | 51,926 | 2.6% |
WA | 46,128 | 2.3% |
AZ | 43,850 | 2.2% |
TN | 42,133 | 2.1% |
MA | 41,909 | 2.1% |
IN | 39,959 | 2.0% |
MO | 38,007 | 1.9% |
MD | 37,880 | 1.9% |
WI | 36,239 | 1.8% |
CO | 34,111 | 1.7% |
MN | 33,783 | 1.7% |
SC | 32,029 | 1.6% |
AL | 29,890 | 1.5% |
KY | 28,008 | 1.4% |
LA | 27,987 | 1.4% |
OR | 26,088 | 1.3% |
OK | 23,784 | 1.2% |
CT | 22,139 | 1.1% |
NV | 20,138 | 1.0% |
IA | 20,021 | 1.0% |
UT | 19,809 | 1.0% |
AR | 18,067 | 0.9% |
KS | 17,904 | 0.9% |
MS | 17,803 | 0.9% |
NM | 12,120 | 0.6% |
NE | 12,067 | 0.6% |
ID | 11,860 | 0.6% |
WV | 9,924 | 0.5% |
ME | 8,181 | 0.4% |
NH | 8,018 | 0.4% |
HI | 7,925 | 0.4% |
DE | 6,105 | 0.3% |
SD | 6,061 | 0.3% |
RI | 6,041 | 0.3% |
MT | 5,899 | 0.3% |
ND | 4,052 | 0.2% |
VT | 4,023 | 0.2% |
DC | 4,005 | 0.2% |
WY | 3,987 | 0.2% |
AK | 3,955 | 0.2% |
| Pair | Observed | Reference |
|---|---|---|
age × a1c_value | 0.285 | 0.140 |
age × bmi | 0.001 | 0.100 |
bmi × waist_circumference_cm | 0.760 | 0.850 |
bmi × weight_kg | 0.888 | 0.780 |
height_cm × weight_kg | 0.516 | 0.450 |


| Statistic | Value |
|---|---|
| count | 2,000,000 |
| mean | 5.69 |
| std dev | 1.00 |
| min | 4.00 |
| max | 14.00 |
| Statistic | Value |
|---|---|
| count | 2,000,000 |
| mean | 47.47 |
| std dev | 18.49 |
| min | 18.00 |
| max | 95.00 |
| Statistic | Value |
|---|---|
| count | 2,000,000 |
| mean | 29.49 |
| std dev | 6.71 |
| min | 15.00 |
| max | 65.00 |
| Statistic | Value |
|---|---|
| count | 2,000,000 |
| mean | 168.48 |
| std dev | 9.90 |
| min | 140.00 |
| max | 210.00 |

| Statistic | Value |
|---|---|
| count | 2,000,000 |
| mean | 97.56 |
| std dev | 15.81 |
| min | 55.00 |
| max | 175.00 |
| Statistic | Value |
|---|---|
| count | 2,000,000 |
| mean | 84.16 |
| std dev | 21.91 |
| min | 34.90 |
| max | 192.30 |
Single large dataset — 1 × 2M records
Scale evidence: a single 2M-row dataset generated end-to-end via the async endpoint and streamed to object storage by multipart upload.
Categorical fidelity
Chi-squared test vs reference; effect size is Cramér's V. A small effect size = the synthetic distribution tracks the reference.
| Attribute | Verdict | Cramér’s V |
|---|---|---|
ckd_status | match | 0.098 |
diabetes_status | match | 0.071 |
education | match | 0.068 |
employment_status | match | 0.055 |
ethnicity | match | 0.008 |
hypertension_status | match | 0.016 |
insurance_type | match | 0.080 |
marital_status | match | 0.043 |
race | match | 0.098 |
sex_at_birth | match | 0.000 |
smoking_status | match | 0.058 |
state | match | 0.006 |
Numeric fidelity
Kolmogorov–Smirnov distance vs the reference distribution; lower D = closer fit.
| Attribute | Verdict | KS D | Reference |
|---|---|---|---|
a1c_value | close | 0.0955 | NHANES 2017-2020 (LBXGH adult mean) |
age | match | 0.0178 | ACS 2022 (US adults) |
bmi | match | 0.0193 | NHANES 2017-2020 (US adults) |
height_cm | match | 0.0226 | NHANES 2017-2020 (adult height) |
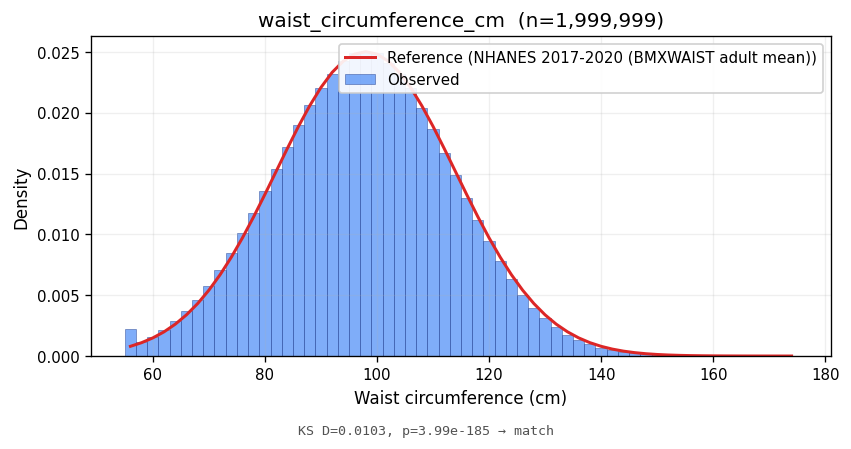
waist_circumference_cm | match | 0.0103 | NHANES 2017-2020 (BMXWAIST adult mean) |
weight_kg | match | 0.0137 | NHANES 2017-2020 (adult weight) |
Correlations
Observed pairwise correlation vs the published reference.
| Pair | Observed | Reference | Verdict |
|---|---|---|---|
age × a1c_value | 0.285 | 0.140 | match |
age × bmi | 0.000 | 0.100 | match |
bmi × waist_circumference_cm | 0.760 | 0.850 | match |
bmi × weight_kg | 0.889 | 0.780 | match |
height_cm × weight_kg | 0.516 | 0.450 | match |
Distributions
Each attribute's generated distribution against its reference curve.

Generated category counts across 2,000,000 records.
| Category | Count | Share |
|---|---|---|
none | 1,176,973 | 58.8% |
prediabetic | 576,882 | 28.8% |
diagnosed_t2dm | 179,525 | 9.0% |
undiagnosed_t2dm | 52,264 | 2.6% |
type1 | 14,356 | 0.7% |
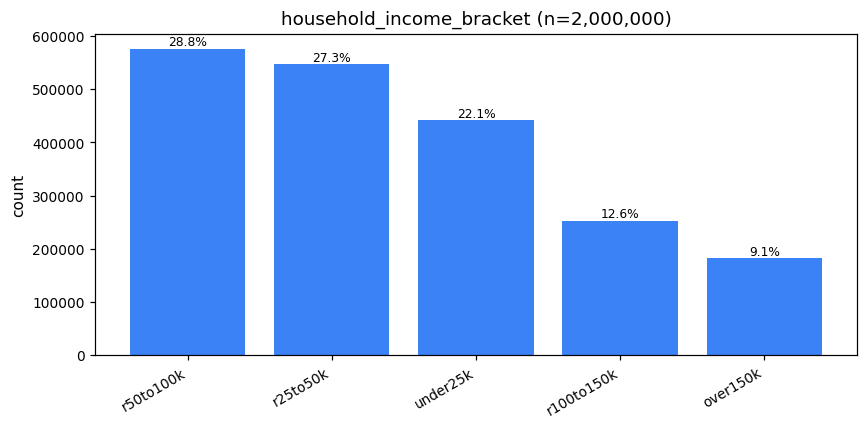
Generated category counts across 2,000,000 records.
| Category | Count | Share |
|---|---|---|
r50to100k | 576,052 | 28.8% |
r25to50k | 546,984 | 27.3% |
under25k | 442,394 | 22.1% |
r100to150k | 252,651 | 12.6% |
over150k | 181,919 | 9.1% |

Generated category counts across 2,000,000 records.
| Category | Count | Share |
|---|---|---|
none | 1,095,162 | 54.8% |
diagnosed | 768,701 | 38.4% |
undiagnosed | 136,137 | 6.8% |
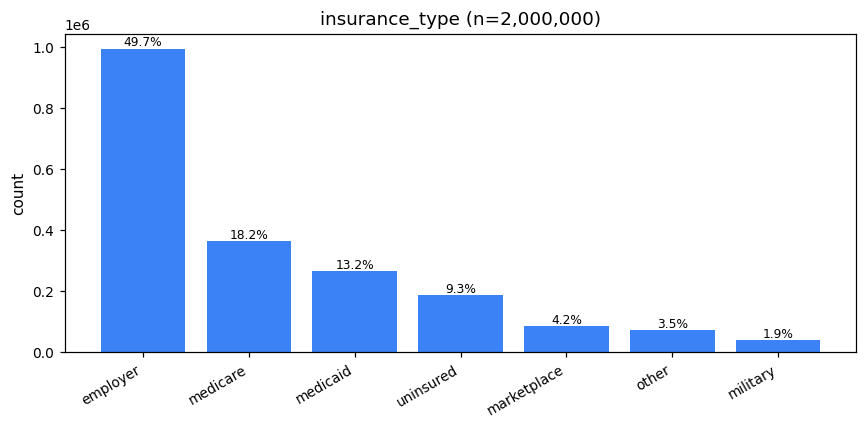
Generated category counts across 2,000,000 records.
| Category | Count | Share |
|---|---|---|
employer | 993,573 | 49.7% |
medicare | 363,193 | 18.2% |
medicaid | 264,295 | 13.2% |
uninsured | 186,011 | 9.3% |
marketplace | 83,809 | 4.2% |
other | 70,945 | 3.5% |
military | 38,174 | 1.9% |
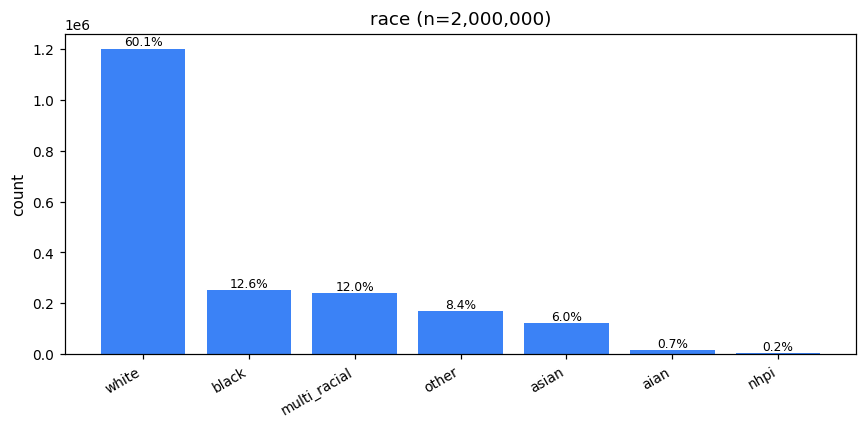
Generated category counts across 2,000,000 records.
| Category | Count | Share |
|---|---|---|
white | 1,202,075 | 60.1% |
black | 251,762 | 12.6% |
multi_racial | 240,089 | 12.0% |
other | 167,598 | 8.4% |
asian | 120,381 | 6.0% |
aian | 14,100 | 0.7% |
nhpi | 3,995 | 0.2% |

Generated category counts across 2,000,000 records.
| Category | Count | Share |
|---|---|---|
female | 1,009,844 | 50.5% |
male | 990,156 | 49.5% |

Generated category counts across 2,000,000 records.
| Category | Count | Share |
|---|---|---|
never | 1,305,731 | 65.3% |
former | 427,442 | 21.4% |
current | 266,827 | 13.3% |
Generated category counts across 2,000,000 records.
| Category | Count | Share |
|---|---|---|
CA | 236,404 | 11.8% |
TX | 179,838 | 9.0% |
FL | 133,057 | 6.7% |
NY | 116,194 | 5.8% |
PA | 77,490 | 3.9% |
IL | 75,583 | 3.8% |
OH | 70,350 | 3.5% |
GA | 65,994 | 3.3% |
NC | 63,791 | 3.2% |
MI | 59,955 | 3.0% |
NJ | 56,203 | 2.8% |
VA | 52,271 | 2.6% |
WA | 46,135 | 2.3% |
AZ | 43,866 | 2.2% |
MA | 42,193 | 2.1% |
TN | 42,139 | 2.1% |
IN | 40,041 | 2.0% |
MO | 37,958 | 1.9% |
MD | 37,712 | 1.9% |
WI | 35,775 | 1.8% |
MN | 34,061 | 1.7% |
CO | 34,015 | 1.7% |
SC | 31,898 | 1.6% |
AL | 30,210 | 1.5% |
LA | 28,341 | 1.4% |
KY | 28,190 | 1.4% |
OR | 25,969 | 1.3% |
OK | 24,175 | 1.2% |
CT | 22,169 | 1.1% |
UT | 20,070 | 1.0% |
NV | 19,894 | 1.0% |
IA | 19,830 | 1.0% |
MS | 18,146 | 0.9% |
AR | 17,929 | 0.9% |
KS | 17,745 | 0.9% |
NE | 12,308 | 0.6% |
NM | 12,116 | 0.6% |
ID | 11,888 | 0.6% |
WV | 9,901 | 0.5% |
HI | 8,026 | 0.4% |
ME | 7,968 | 0.4% |
NH | 7,899 | 0.4% |
DE | 6,132 | 0.3% |
RI | 6,082 | 0.3% |
MT | 6,054 | 0.3% |
SD | 5,864 | 0.3% |
VT | 4,176 | 0.2% |
AK | 4,013 | 0.2% |
DC | 3,998 | 0.2% |
WY | 3,998 | 0.2% |
ND | 3,986 | 0.2% |

| Pair | Observed | Reference |
|---|---|---|
age × a1c_value | 0.285 | 0.140 |
age × bmi | 0.000 | 0.100 |
bmi × waist_circumference_cm | 0.760 | 0.850 |
bmi × weight_kg | 0.889 | 0.780 |
height_cm × weight_kg | 0.516 | 0.450 |

| Statistic | Value |
|---|---|
| count | 2,000,000 |
| mean | 5.69 |
| std dev | 1.00 |
| min | 4.00 |
| max | 14.00 |
| Statistic | Value |
|---|---|
| count | 2,000,000 |
| mean | 47.49 |
| std dev | 18.49 |
| min | 18.00 |
| max | 95.00 |

| Statistic | Value |
|---|---|
| count | 2,000,000 |
| mean | 29.49 |
| std dev | 6.72 |
| min | 15.00 |
| max | 65.00 |

| Statistic | Value |
|---|---|
| count | 2,000,000 |
| mean | 168.48 |
| std dev | 9.90 |
| min | 140.00 |
| max | 210.00 |
| Statistic | Value |
|---|---|
| count | 2,000,000 |
| mean | 97.56 |
| std dev | 15.82 |
| min | 55.00 |
| max | 175.00 |

| Statistic | Value |
|---|---|
| count | 2,000,000 |
| mean | 84.18 |
| std dev | 21.93 |
| min | 34.90 |
| max | 200.10 |